


Levels of coronavirus are showing clear signs of coming down throughout most of the UK, more evidence suggests.
After at least a month of lockdown, figures from the Office for National Statistics (ONS) suggest positive tests are falling in England, Scotland and Northern Ireland.
The UK's reproduction or R number is estimated to be between 0.7 and 1.
Meanwhile, Downing Street confirmed all adults aged 50 and over should receive a coronavirus vaccine by May.
A spokesman said Prime Minister Boris Johnson would set out a "precise timeline" for vaccinations when he publishes the government's roadmap for lifting lockdown restrictions in England on 22 February.
Ministers had previously refused to discuss the date by which the over-50s would be offered a Covid jab.
Swab tests from people signed up to the Covid symptom app suggest cases are down 70% from their peak.
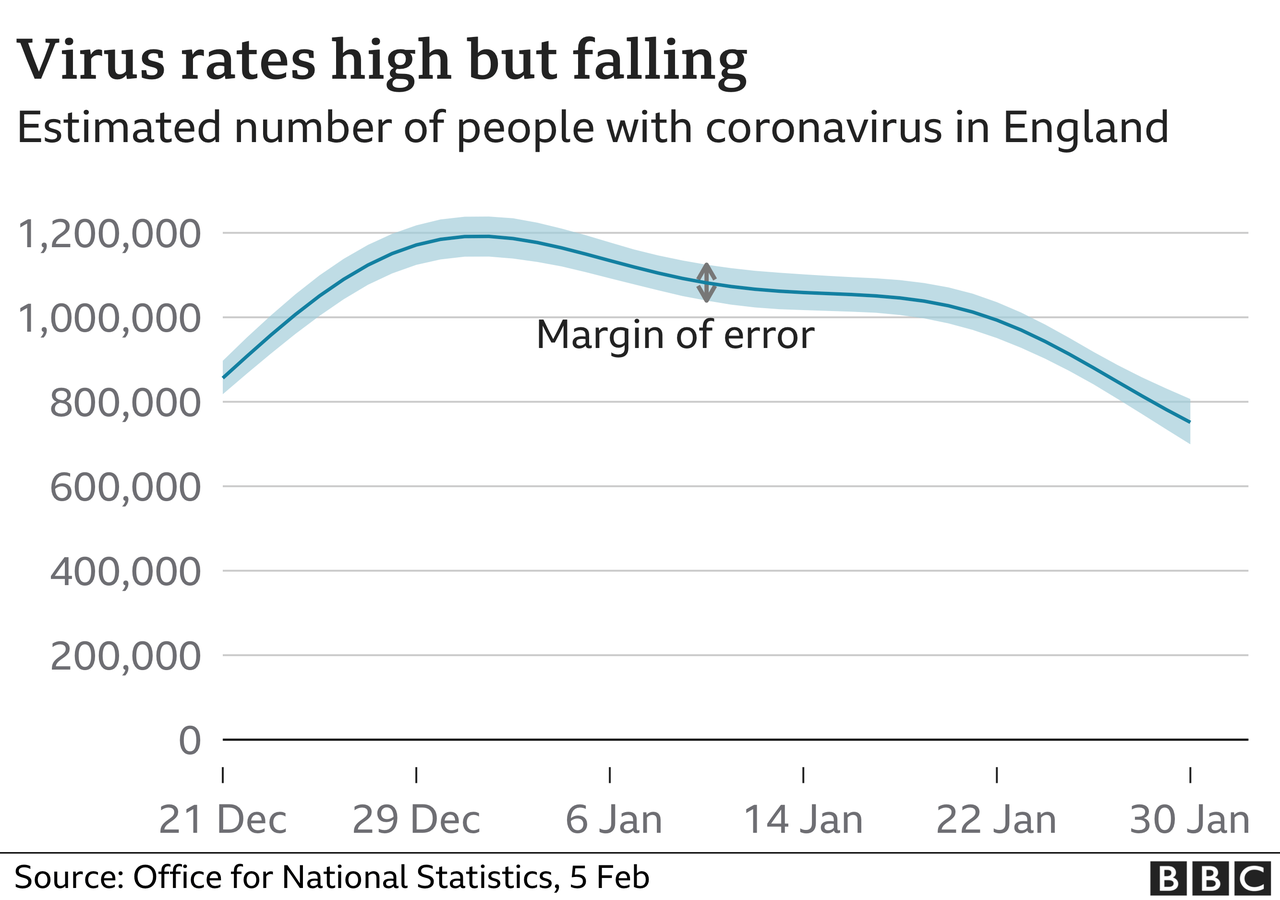
But experts warn that infection levels still remain high.
An estimated one in 65 people in both England and Northern Ireland had the virus, one in 70 in Wales and one in 115 in Scotland.
Cases fell in every UK nation apart from Wales where infections remained stable.
The ONS's data is slightly out of date - covering the week up to 30 January - so may not reflect the situation right now.
Similarly, the R number takes information from lots of different sources to provide a "consensus view of what the epidemic is doing", according to scientist advising government, Graham Medley.
But all of these different sources are slightly "behind the curve" because "we never observe the exact moment when somebody is infected but have to wait until they develop symptoms, get tested, go to hospital and die," he said.
Taken altogether, though, along with other sources like local authorities' reports of outbreaks in their areas, they give a good sense of roughly what's going on.
In theory the R number represents how many extra people each infected person gives the virus to.
But in reality, it is a calculation based on infections, hospitalisations and deaths, and is used to give a sense of whether the epidemic - including its impact on the health service - is broadly growing or shrinking.
Aside from the ONS, tother surveillance studies - where random samples of people are swabbed whether or not they have symptoms - also show cases coming down, starting somewhere around the second week of January.
The confirmed cases published on the government's daily dashboard should in theory be the most up to date, but they are skewed by who comes forward for testing.